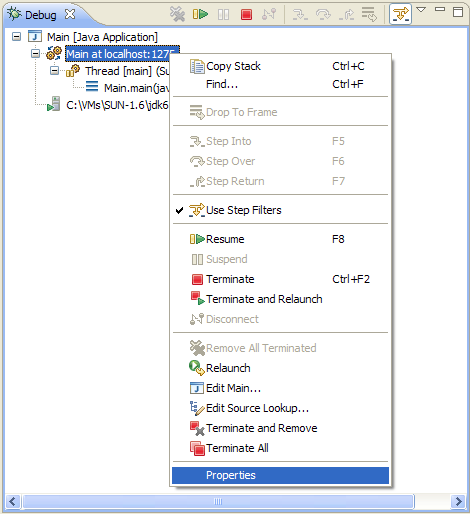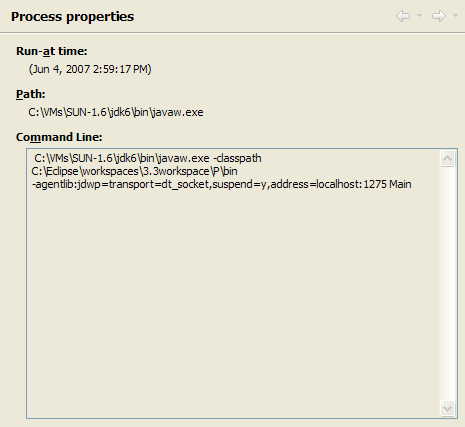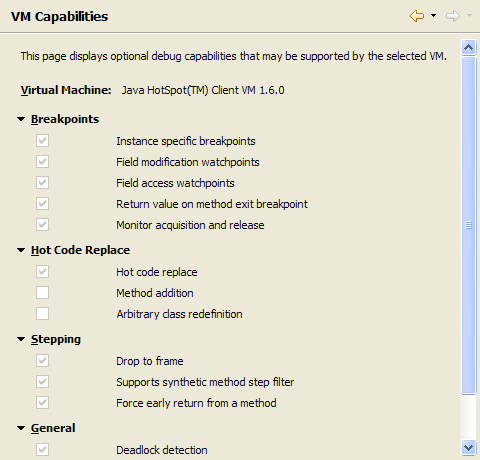
Select the Properties command to open the properties dialog for the selected debug target, thread, thread group, process or stackframe.
From the resulting dialog you can copy information about the selected debug target and view the actual command line used to run the target.

You can also view the capabilities of the VM used to launch the associated target


Debugger
Local debugging
Remote debugging

Changing debugger launch options
Connecting to a remote VM with the Remote Java application launch configuration
Disconnecting from a VM
Launching a Java program
Preparing to debug
Resuming the execution of suspended threads
Running and debugging
Stepping through the execution of a program
Suspending threads
